Equity Analyst

• インサイト
Power demand is surging: Who will benefit from a new electricity supercycle?
The US is entering a new era of electricity demand growth – a power supercycle. This will mean a seismic shift in how capital is deployed across energy generation, grid infrastructure, and storage technologies, and significant investment opportunities for Robeco’s Smart Energy strategy.
執筆者

まとめ
- AI, electrification and decarbonization are accelerating power demand
- Legacy grids and infrastructure underinvestment are limiting supply
- Demand-supply mismatch is driving a new investment supercycle
The US is at the epicenter of this acceleration, with power demand in the next decade expected to increase almost three times the pace of the last two.1 This will bring its total consumption from 4,100 TWh in 2024 to 5,300 TWh in 2035.2 Such an increase is equivalent to the combined annual consumption of France, Germany and Italy.3
Figure 1 – Electricity demand set to surge in coming decades
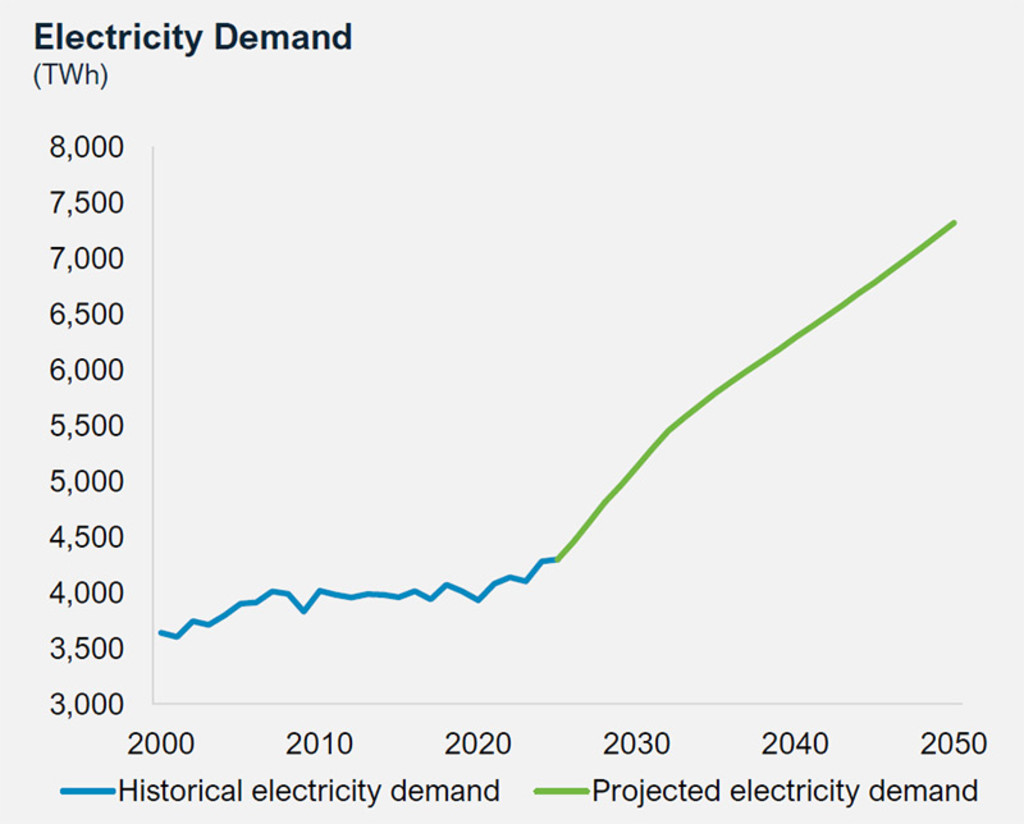
Source: NextEra Energy, September 2025.
US power demand in the next decade is expected to increase almost three times the pace of the last two
The primary demand drivers are clear:
Data centers / AI computing: Already big users of electricity, data center power consumption is expected to increase at an annual rate of 15% (CAGR) by 2035. Data centers already account for around 3% of the total demand and could well reach 10% by 2035.
Residential & commercial heating and cooling: According to the IEA, electricity will overtake natural gas for space and water heating through new construction or retrofits as office buildings, retail spaces, and institutional facilities transition to electric HVAC. We expect these segments to grow at a rate of 1.1% annually (CAGR) to 2035, well above the 0.7% rate of the past decade.
Industrial electrification: US manufacturing is expanding – driven by tariffs and reshoring trends – and integrating AI-driven automation and robotics. We expect industrial electrification to grow 1.9% CAGR to 2035, well above the 0.6% historical average.
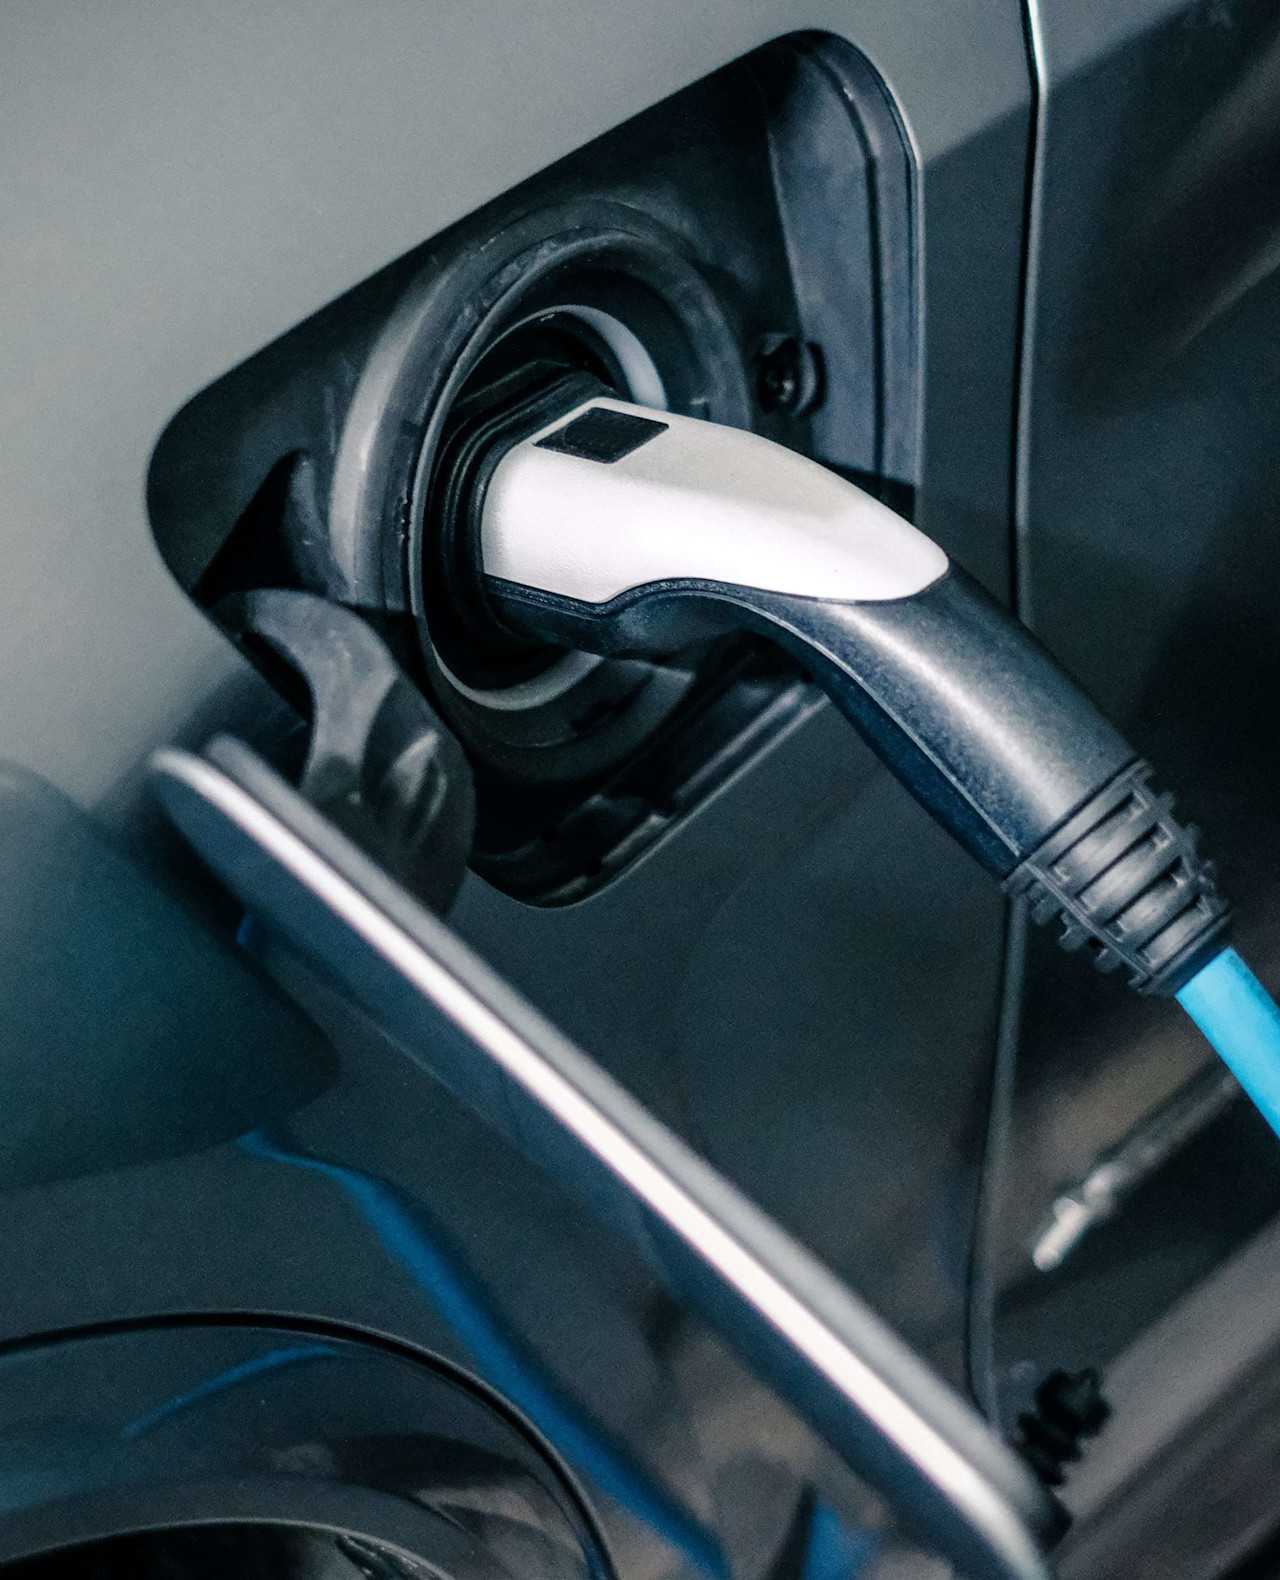
Transport: While US EV sales have disappointed, there are around 5 million EVs on US roadways today representing around 2% of the total passenger fleet. Even if the mix of new vehicle sales would remain flat (~9%), the number of EVs would still rise by ~15% CAGR to 2035 to 22 million. In 2035, EVs could represent close to 10% of the total demand.
Figure 2 – Main drivers of increased US power demand
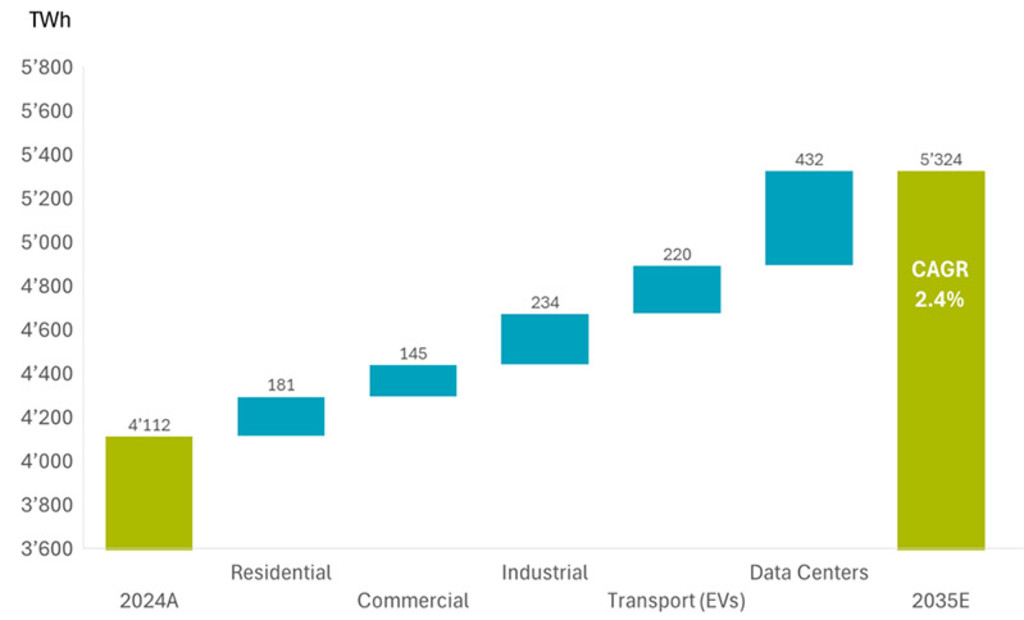
After more than two decades of flat demand, total US energy demand is expected to rise to 5,324 TWh by 2035 (up 2.4% CAGR from the actual demand of 4,112 TWh in 2024). Data centers are expected to account for 432 TWh or 36% of new demand, followed by the electrification of industry (19%), transport (18%), residential (15%), and commercial buildings (12%).
Source: Robeco, 2025.
A supply-demand mismatch is raising costs
After decades of flat consumption, the US grid is not prepared for this scale of growth. Coal retirements and slow permitting for renewables have constrained electricity supply.4 Power regulators warn that half the US is facing power supply shortfalls in the next decade.5
Distribution complicates things further. Over 30% of transmission lines and nearly half of distribution infrastructure are approaching end-of-life. Capacity prices in PJM markets have risen tenfold in four years, while electricity prices have grown at 4% annually, underscoring the stress between reliability and affordability.6 Over the past five years, electric bills across the US have increased 24%. 7
最新のインサイトを受け取る
投資に関する最新情報や専門家の分析を盛り込んだニュースレター(英文)を定期的にお届けします。
Policy tailwinds and regulatory shifts
The US policy environment is evolving to meet this surge. The 2025 Energy Emergency Order introduced fast-track permits and deregulation, particularly for gas-fired power plants and transmission upgrades. Simultaneously, the legacy incentives of the Inflation Reduction Act and the One Big Beautiful Bill Act continue to channel capital into renewables and grid resilience. The bipartisan consensus on grid reliability ensures a supportive backdrop for US energy infrastructure investment.
Addressing the supply gap
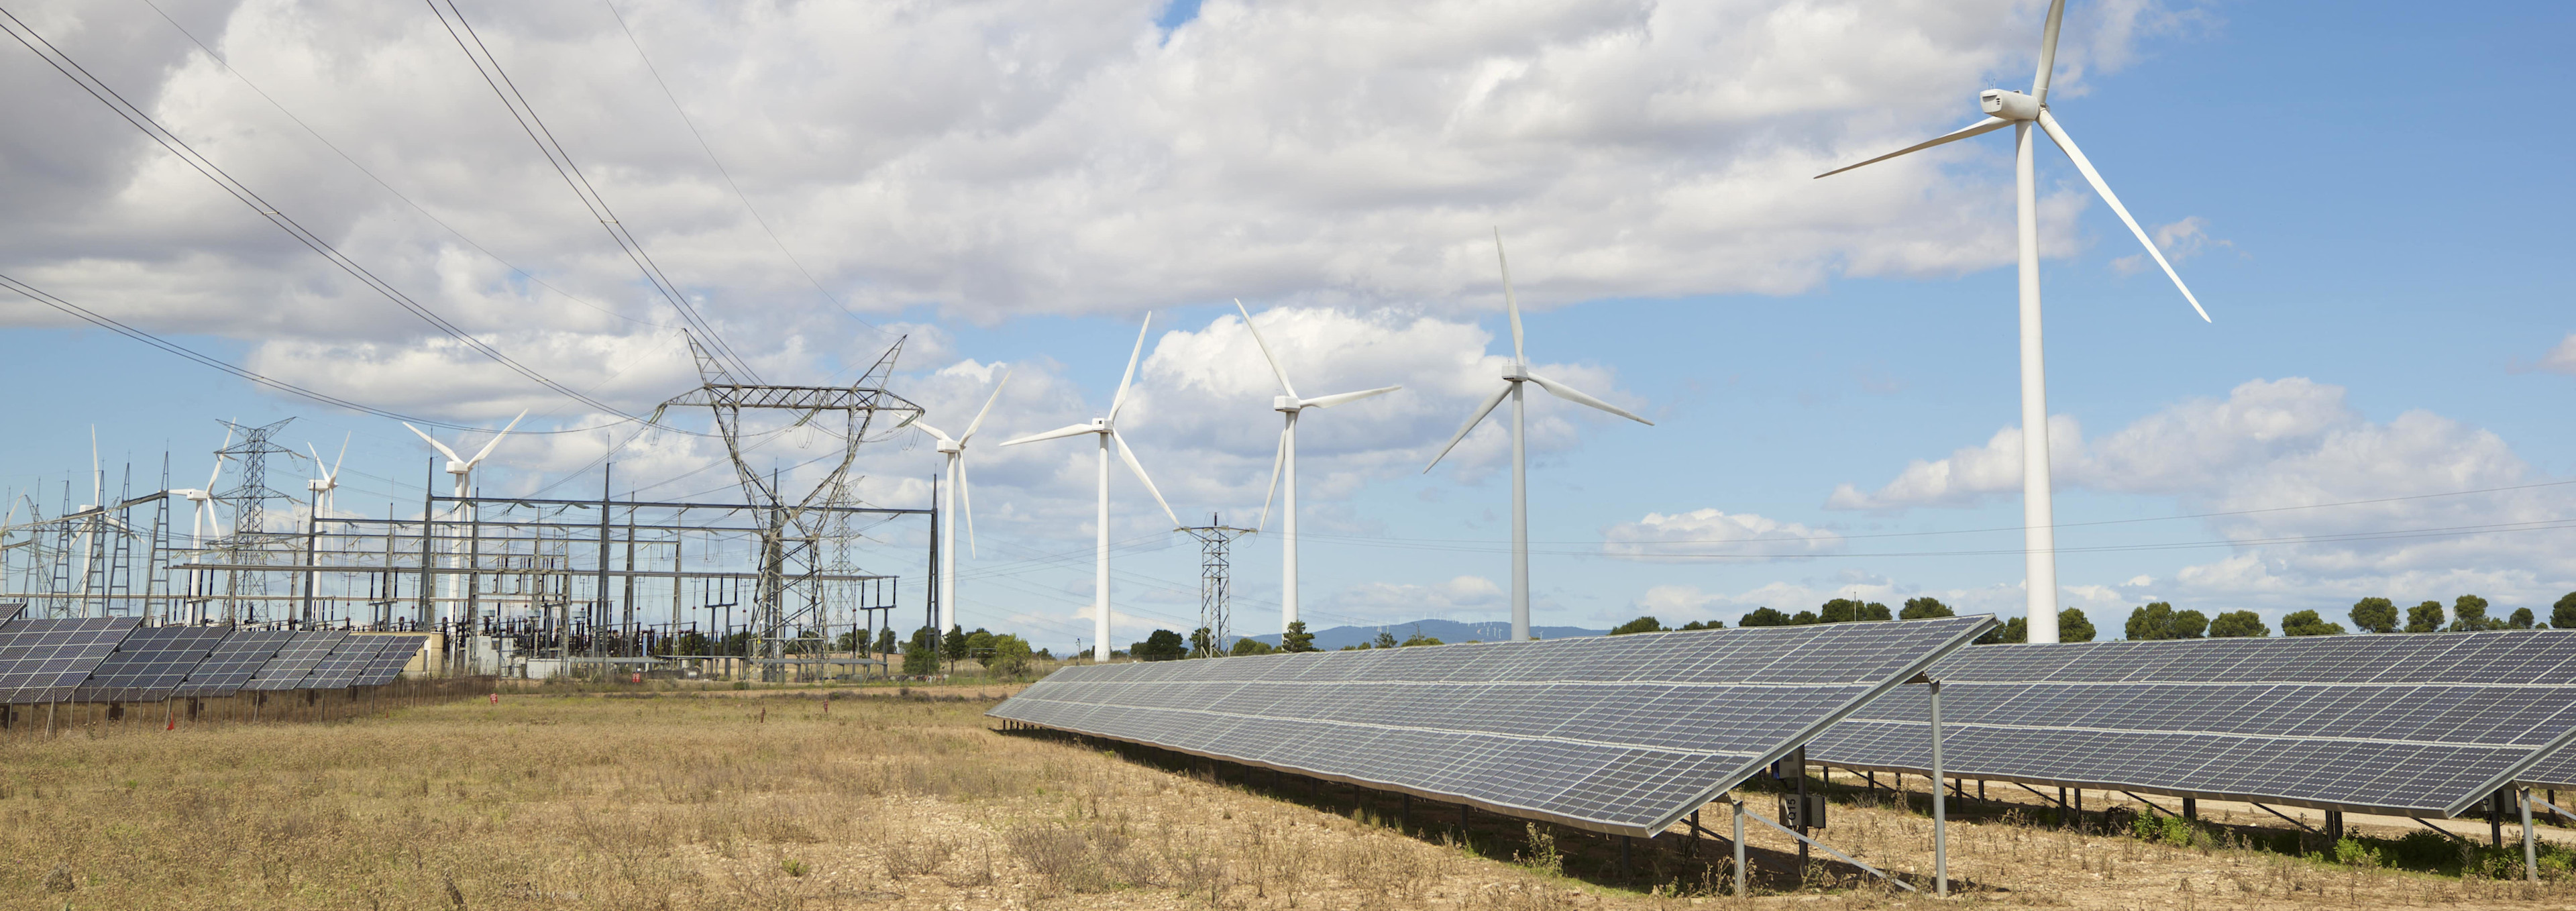
We anticipate that the US will add between 500 GW and 600 GW of new capacity by 2035, with renewables accounting for approximately 60% to 70% of these additions. Natural gas will remain the backbone of reliability. Despite political scrutiny and the One Big Beautiful Bill, renewables are still expected to outpace new gas capacity. Supported by the current US administration, in the interim, coal plants may see extensions and utilities are already actively planning new gas generation projects. Nuclear power is also gaining popularity but high-cost and long-construction times mean it’s not a viable near-term solution.8
Despite political scrutiny and the One Big Beautiful Bill, renewables are still expected to outpace new gas capacity
According to the International Energy Agency (IEA), the US energy mix by 2040 could be made of 900 GW of solar, 600 GW of wind, 450 GW of natural gas, 250 GW of battery storage, 100 GW coal and nuclear.9 This mix highlights the need for ‘always-available’ dispatchable power to complement intermittent renewable energy sources.
Figure 3 – Electricity supply is shifting to renewables and gas
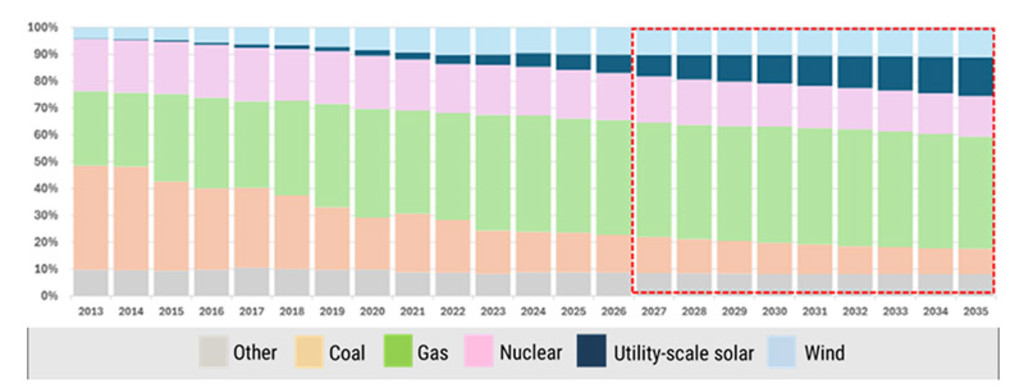
Source: Jefferies, Citi, EIA, Wood Mackenzie, BNEF, September 2025.
Grid modernization: A public/private effort
As load growth accelerates, legacy power networks will come under increasing strain. The Department of Energy stressed that the US will need to build as much new transmission capacity in the next 10 years as it did over the past 60. By 2050, power networks will need to be at least two to three times larger to keep up with electrification trends, data center expansion and the clean energy transition.
The buildout means grid spending is expected to exceed USD 100 billion annually by the end of the decade, with grid infrastructure, smart grid components, as well as end-use equipment suppliers expected to benefit.
Grid infrastructure – transmission towers, high-voltage cables, step-down transformers, switchgear
Smart grid components – hard and software equipment including sensors, chips and analytics
End-use equipment – EV components, charging networks, building electrification gear
As the climate transition and the push to decarbonize accelerate, utilities are designing plans to integrate dispatchable and renewable assets. Companies active in wind and solar value chains, battery and storage players as well as other power ‘enablers’ will undoubtedly benefit from these moves to secure power generation.
Meanwhile, Big Tech hyperscalers such as Amazon, Google, and Microsoft are increasingly acting as power producers – investing in on-site gas turbines and modular nuclear pilots as well as negotiating exclusive power-purchasing agreements (PPAs) with local utilities. Combined with public sector expansion, private efforts will further boost investments in smart energy generation and transmission infrastructure.
Conclusion
The global economy is shifting from hydrocarbons to electrons. That’s a multi-decade evolution underpinned by AI, EVs and electrification, industrial policy, and an aging and ill-equipped grid. It is nothing short of a power demand supercycle. In this new era, access to power becomes the new competitive advantage, and strategies aligned with the buildout of generation, storage, and grid capacity stand at the forefront of a compelling investment cycle.
Important note: The companies referenced are for illustrative purposes only in order to demonstrate the investment strategy on the date stated. The companies are not necessarily held by Robeco’s Smart Energy strategy. This is not a buy, sell or hold recommendation, nor should any inference be made on the future development of the company.
Footnotes
1 Moving from two decades of less than 1% growth to 2.4% CAGR through 2035.
2 ‘Power check: Watt’s going on with the grid?.’ Bank of America Global Research. July 2025.
3 Energy consumption figures for Italy, Germany and France are for 2023.
4 US Energy Information Administration, February 2024. US Department of Energy, Transmission Interconnection Roadmap: Transmission Interconnection by 2035.
5 ‘Half US at high risk of power shortfall in next decade, regulators says. Reuters, December 2024.
6 Electricity is more expensive in peak hours due to high demand. Capacity pricing refers to the extra cost paid by end-consumers to ensure electricity that is available on-demand. PJM refers to the regional grid operator for the US Mid-Atlantic and Midwest regions. These represent major economic and population hubs which can reliably proxy broader trends in US electricity use.
7 US Energy Information Administration, 2025.
8 The average construction time is 9.5 years globally. World Nuclear Performance Report, World Nuclear Association, 2025. This figure varies significantly by region and reactor type. China achieves shorter construction time due to standardized designs and streamlines regulatory processes. Western countries tend to have longer timelines frequently exceeding 15 years due to complex permitting, financing among other challenges. (IEA, JP Morgan)
9 IEA World Energy Outlook, 2024.
重要事項
当資料は情報提供を目的として、ロベコ・ジャパン株式会社(以下「当社」)が独自に作成、または当社のグループ会社(Robeco Institutional Asset Management B.V.およびその関連会社を含む)から提供された資料を当社が編集・翻訳したものです。資料中の個別の金融商品の売買の勧誘や推奨等を目的とするものではありません。記載された情報は十分信頼できるものであると考えておりますが、その正確性、完全性を保証するものではありません。意見や見通しはあくまで作成日における弊社の判断に基づくものであり、今後予告なしに変更されることがあります。運用状況、市場動向、意見等は、過去の一時点あるいは過去の一定期間についてのものであり、過去の実績は将来の運用成果を保証または示唆するものではありません。また、記載された投資方針・戦略等は全ての投資家の皆様に適合するとは限りません。当資料は法律、税務、会計面での助言の提供を意図するものではありません。 ご契約に際しては、必要に応じ専門家にご相談の上、最終的なご判断はお客様ご自身でなさるようお願い致します。 運用を行う資産の評価額は、組入有価証券等の価格、金融市場の相場や金利等の変動、及び組入有価証券の発行体の財務状況による信用力等の影響を受けて変動します。また、外貨建資産に投資する場合は為替変動の影響も受けます。運用によって生じた損益は、全て投資家の皆様に帰属します。したがって投資元本や一定の運用成果が保証されているものではなく、投資元本を上回る損失を被ることがあります。弊社が行う金融商品取引業に係る手数料または報酬は、締結される契約の種類や契約資産額により異なるため、当資料において記載せず別途ご提示させて頂く場合があります。具体的な手数料または報酬の金額・計算方法につきましては弊社担当者へお問合せください。 当資料及び記載されている情報、商品に関する権利は弊社に帰属します。したがって、弊社の書面による同意なくしてその全部もしくは一部を複製またはその他の方法で配布することはご遠慮ください。 商号等: ロベコ・ジャパン株式会社 金融商品取引業者 関東財務局長(金商)第2780号 加入協会: 一般社団法人 資産運用業協会