Investment Writer


• Active ETF in focus
Why investors are turning to European equities
3D European Equity ETF
Active ETFs are reshaping global investment markets, offering investors a flexible and transparent way to access active strategies. As adoption accelerates, however, the expanding range of solutions also raises a more practical question: where and how can they add the most value in portfolios?
In this series, we explore that question by focusing on compelling investment cases. For each, we examine the opportunity itself, before considering how a systematic active approach can help capture it more effectively.
Authors

Jessica Monkivitch

Anna Heldring
Investment writer
Top keywords
Summary
After years of outflows from active European equity strategies, driven partly by relative underperformance and the powerful pull of US mega-cap technology stocks, investor interest in the region is beginning to recover. Several factors support the case for reconsidering Europe.
European equities continue to trade at clearly more attractive valuations relative to their US counterparts, with an average discount across valuation measures of more than 40%, 1 as illustrated by a forward P/E of 14.8x in Europe versus 21.7x in the US. At the same time, Europe offers a more balanced sector profile across financials (23.71%), industrials (19.32%), and healthcare (12.9%), with no single sector dominating the index, unlike the US where information technology alone accounts for 38.33%. 2
Europe is also far less concentrated in single names: its ten largest constituents make up just 20.6% of the index, versus 38.4% in the US. Many large European companies generate a substantial share of their revenues outside Europe,3 giving investors exposure to global business models rather than a purely domestic regional story. Thus, for investors seeking to rebalance portfolios, reduce reliance on a narrow group of mega-cap stocks, and broaden regional exposure, European equities can play a valuable role.
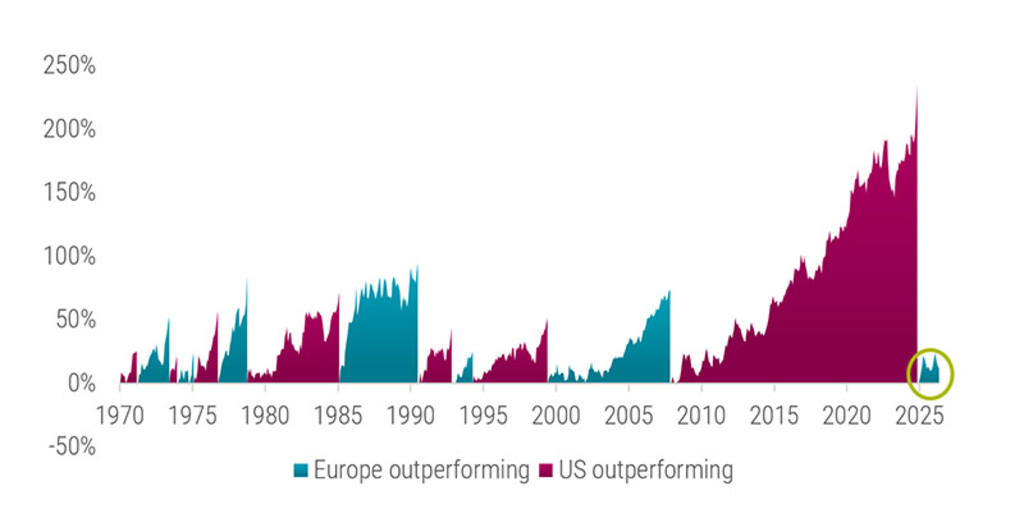
Figure 1 | Making Europe Great Again? Relative performance of European vs. US equities
Past performance is no guarantee of future results. The value of your investments may fluctuate.
Source: Robeco, LSEG, MSCI. The figure shows the relative performance of the MSCI USA Index versus the MSCI Europe Index. A new cycle begins after the peak of the previously outperforming market, once the previously underperforming market has outperformed by at least 20% from its preceding low. Performance is based on end-of-month total return indices in USD. The sample period spans from January 1970 to May 2026.
History shows that leadership between the US and Europe has alternated over time. The recent outperformance of European equities may therefore be an early sign that investors are beginning to reassess a long-neglected market.
A diverse market to navigate
Capturing the European equity opportunity is not simply a matter of making a broad regional allocation. Europe is a diverse market, spanning many countries, currencies, sectors and business models: fertile ground for active investors, but complex.
This makes a systematic approach highly suitable for the European landscape. Rather than relying on a single market view or a binary call on regional rotation, a quantitative process can evaluate a broad universe of stocks consistently, using multiple return drivers such as value, quality, momentum, analyst revisions and short-term signals, identifying attractive opportunities across the market while reducing reliance on any one factor, sector or style.
At the same time, a benchmark-aware framework helps control unintended risks, manage concentration, and keep the portfolio aligned with the role European equities are expected to play in a broader allocation. Robeco’s 3D European Equity ETF is designed to capture this opportunity through a disciplined ‘3D’ enhanced indexing approach, combining broad European equity exposure with a systematic framework that dynamically balances three dimensions of investing: return, risk and sustainability.
How the investor benefits

1. Efficient access to European equities
The ETF offers broad exposure to European equities in a transparent and flexible active ETF wrapper. For investors looking to reconsider regional allocations, it provides a practical way to access Europe while maintaining the liquidity and efficiency associated with ETFs.

2. A systematic return engine
The strategy uses Robeco’s proprietary stock selection model, which applies a combination of proven signals systematically across the European equity universe in its aim to identify companies with stronger return potential while maintaining a diversified approach.

3. Dynamic balance across return, risk and sustainability
Robeco’s 3D approach goes beyond traditional passive exposure by integrating three dimensions into portfolio construction: return, risk and sustainability. The strategy seeks to improve return potential while actively managing benchmark-relative risk, turnover and transaction costs. Sustainability considerations are incorporated dynamically, using multiple inputs including Robeco’s SDG Framework.
European equities offer a compelling opportunity for investors seeking broader diversification, attractive valuations and exposure beyond US technology dominance. But the region’s diversity also calls for a disciplined approach to stock selection, risk management and portfolio construction. Robeco’s 3D European Equity ETF is designed to meet this need, offering investors a research-driven, benchmark-aware and efficient way to participate in Europe’s evolving opportunity set.
Footnotes
1 Average discount based on P/E, forward P/E, P/B and 1/DY.
2 Source: MSCI, Robeco. Data as of 29 May 2026. Average discount based on P/E, forward P/E, price-to-book and inverse dividend yield for MSCI Europe versus MSCI USA.
3 See Robeco article ‘Old world, new money’
3D European Equity UCITS ETF EUR Acc
- performance ytd (31-7)
- 13.56%
- SFDR (31-7)
- Article 8
- Dividend Paying (31-7)
- No
- Current Price (26-8)
- 6.80
- Inception date (31-7)
Past performance is no guarantee of future results. The value of the investments may fluctuate. Annualized (for periods longer than one year). Performances are net of fees and based on transaction prices.
Our core strengths