Compelling spreads
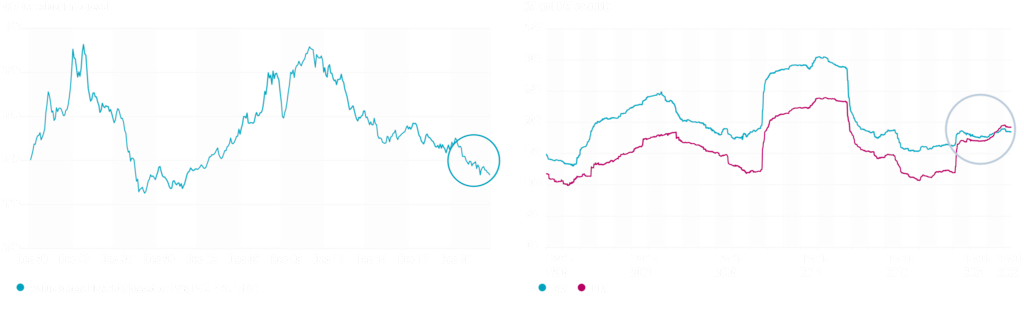
The left-hand chart shows the valuation spread of the MSCI World Index vs. the MSCI Emerging Market Index. The valuation spread is based on four bottom-up-calculated multiples (price-to-book, price-to-earnings, price-to-cashflow, and price-to-dividend). For each multiple the valuation ratio of the MSCI Emerging Markets Index is divided by the same valuation ratio for the MSCI World Index. The right-hand chart shows the five-year rolling standard deviation in MSCI Emerging Market Index and the MSCI World Index. Source: Robeco, MSCI, August 2023.