• Active ETF in focus

Enhanced indexing for global equity investing

Robeco 3D Global Equity UCITS ETF

Active ETFs1 are giving investors a more flexible way to access active strategies, combining the convenience and flexibility of an ETF with the ability to move beyond a purely passive approach.

In this series, we look at where that active element may be especially useful. This edition focuses on global equities and how that exposure can be implemented more efficiently.
Beyond simply buying the index

Authors

    Head of Exchange Traded Funds

Beyond simply buying the index

For many investors, global developed market equities are a core allocation. They provide broad access to some of the world’s largest and most established companies and often form the foundation of long-term equity portfolios. But broad index exposure is not necessarily neutral. Most equity indices weight companies according to their market capitalization. As companies become larger, they automatically take up more space in the index. The index does not ask whether a company still looks attractively valued, whether its fundamentals are improving or whether its sustainability risks are being managed well. It simply follows its rules.

That is where enhanced indexing comes in. The strategy starts with the benchmark as the reference point, then makes many small active decisions around it. The goal is to keep the broad characteristics investors expect from a core global equity allocation, while using research-driven stock selection to seek better outcomes over time.

Established factors, changing rewards

Academic research has long shown that certain company characteristics, also referred to as factors, such as value, quality and momentum, have been associated with return differences over time. These factors form the foundation of many systematic approaches, including enhanced indexing. Yet these factor rewards are not constant. Some periods are more supportive than others, and simple factor definitions can lose effectiveness as markets evolve.

For investors, the point is that systematic stock selection needs to be diversified, research-based and continually refined. A robust process should ask several questions at once: does the stock look attractively valued? Is the business financially strong? Is the price trend supportive? Are analysts becoming more positive? Are short-term signals improving or deteriorating?

From generic factors to Robeco definitions

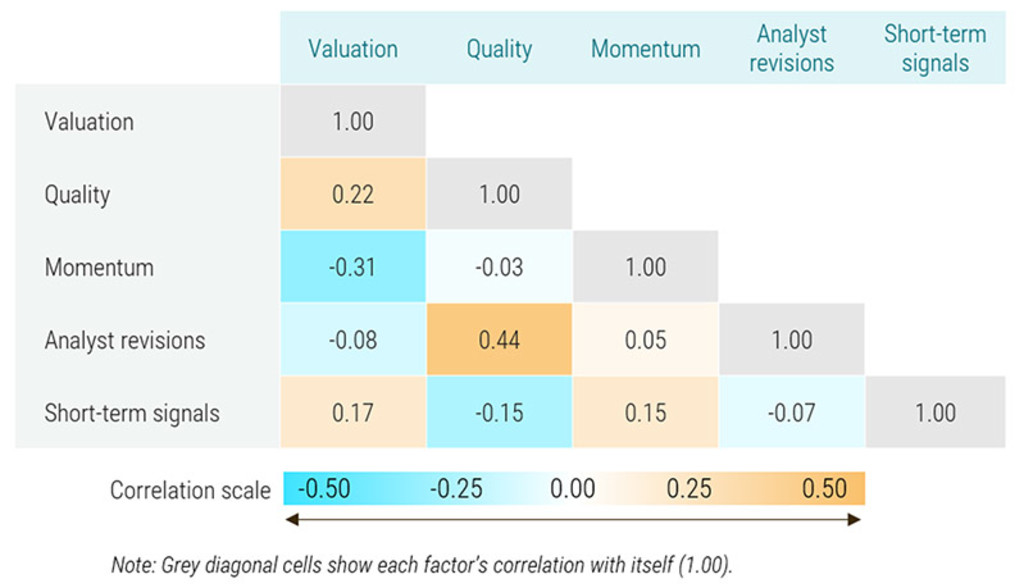
Robeco’s 3D Global Equity UCITS ETF, based on our Global Developed Enhanced Index Equities strategy, uses a proprietary stock selection model that combines several groups of signals: value, quality, momentum, analyst revisions and short-term signals. Each provides a different perspective on a company’s potential return. The low correlation across these factors, as seen in Figure 1, supports genuine diversification.2 This means that returns are not driven by a single common source. Different factors tend to outperform at different points in the cycle, helping to smooth the overall return profile.

Figure 1 | Cross-factor correlation for Robeco QI Global Developed Enhanced Index Equities strategy

Past performance is no guarantee of future results. The value of your investments may fluctuate.

Source: Robeco, as at 31 August 2026. Period covered: 1 January 2019 to 31 August 2026. The chart shows correlations between factor excess returns for the Robeco QI Global Developed Enhanced Index Equities strategy. The underlying returns are calculated in EUR, gross of fees, based on gross asset values. Short-term signals have been reported as a separate factor since 1 January 2019. Correlations may change over time, and historical correlations do not guarantee future diversification benefits. Fees, commissions and other costs reduce investors’ returns. If investment returns are converted from EUR into your local currency, exchange rate fluctuations may increase or decrease those returns.

Importantly, the factors used in the strategy are based on Robeco’s own definitions, developed through long-term quantitative research, practical implementation experience and continuous testing across markets and periods.

That distinction is important because a generic value factor, for example, may simply compare cheap stocks with expensive stocks. A proprietary definition can be more refined: adjusting for sector effects, accounting for risk, avoiding value traps, reducing unnecessary turnover or combining several related indicators. The same principle applies to other factors.

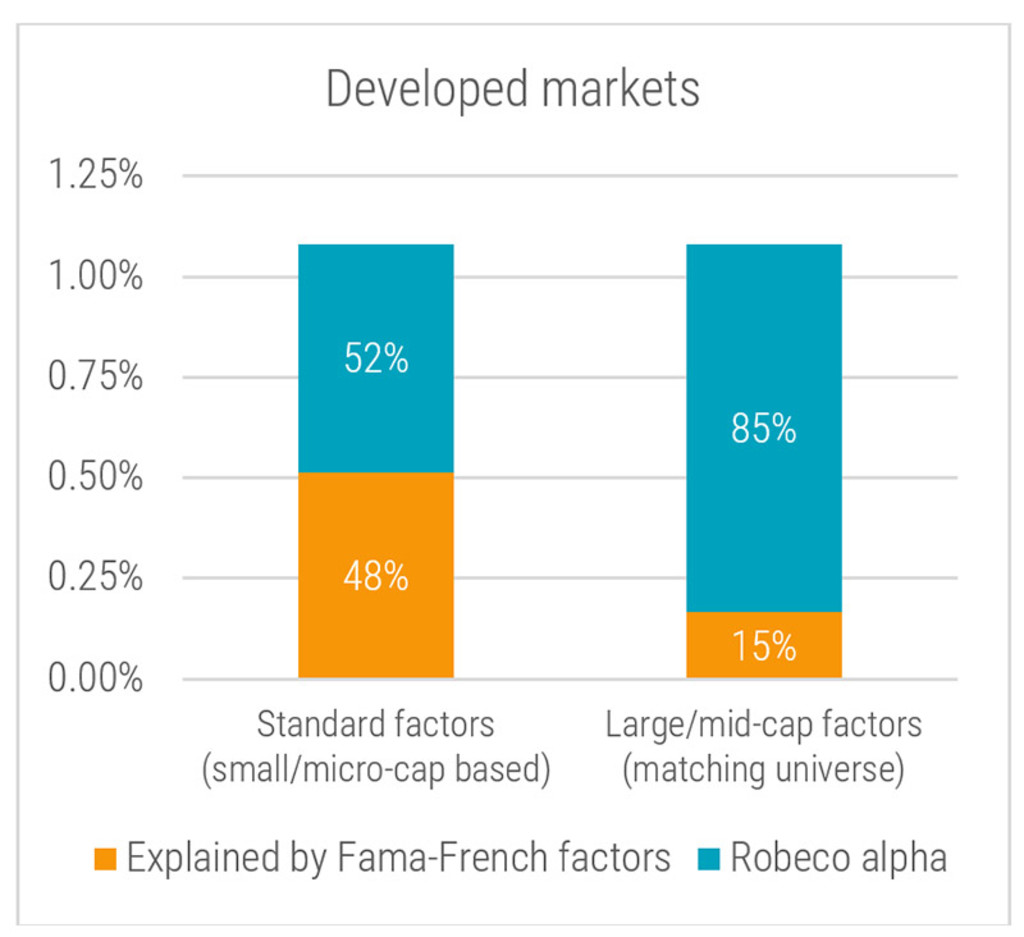
Figure 2 | Robeco alpha beyond generic factors

Past performance is no guarantee of future results. The value of your investments may fluctuate.

Source: Kenneth R. French Data Library; calculations by Robeco. The chart makes a breakdown of the realized outperformance of Robeco’s Global Developed Enhanced Indexing Equities strategy from September 2004 to December 2025 into a part that is explained by academic factors and the remainder, referred to as unique alpha3, based on time-series regressions over the full periods. The academic factors are the standard market, size, value, momentum, profitability, and investment factors for global developed markets from the Kenneth French data library and a variant in which the value, momentum, profitability, and investment are only based on the large-cap segment of the market. Fund returns are gross of fees.

Historical analysis of Robeco’s Enhanced Indexing strategies suggests that a meaningful part of realized relative performance has not been explained by generic academic factor exposure alone. In other words, the added value has not only come from using well-known factors, but also from how those factors are defined, combined and implemented, with a wide array of underlying signals being used to develop a score for each of them.

This is central to the Global 3D story. The strategy is systematic, but not generic. It seeks to capture return opportunities through Robeco’s own research, while remaining close enough to the benchmark to serve as a core global equity allocation.

QI Global Developed Active Equities D EUR

performance ytd (30-9)
17.10%
SFDR (30-9)
Article 8
Dividend Paying (30-9)
No
Current Price (3-11)
149.14
Inception date (30-9)
View the fund
Past performance is no guarantee of future results. The value of the investments may fluctuate. Annualized (for periods longer than one year). Performances are net of fees and based on transaction prices.

QI Global Developed Enhanced Index Equities D EUR

performance ytd (30-9)
16.11%
Performance 3y (30-9)
19.94%
morningstar (30-9)
5 / 5
SFDR (30-9)
Article 8
Dividend Paying (30-9)
No
View the fund
Past performance is no guarantee of future results. The value of the investments may fluctuate. Annualized (for periods longer than one year). Performances are net of fees and based on transaction prices.

A model designed to evolve

Systematic investing is sometimes seen as mechanical. But while the investment process is rule-based, the research behind those rules continues to develop. Markets change, data improves and signals can become more or less effective over time.

Robeco’s researchers and portfolio managers continually review and refine the model. This can involve improving existing signal definitions, incorporating new types of data, testing whether signals remain effective and assessing how they interact with risk, sustainability and implementation costs.

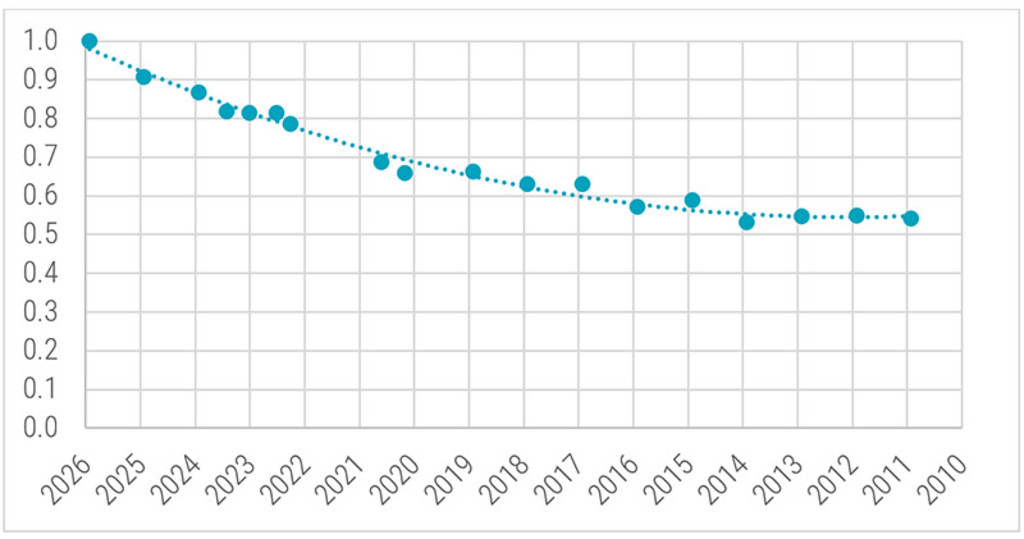
Figure 3 | A research process that keeps evolving

Simulated past performance is no guarantee for future results.

Source: Robeco. For illustration purposes only. This information is presented solely to illustrate the correlations of outperformance relative to the benchmark for the current Robeco QI Global Developed Enhanced Indexing Equities strategy compared to past iterations of the model, measured at individual points in time as indicated on the chart, from January 1986 to December 2025, versus the MSCI World index. This chart does not represent returns of an actual portfolio and is for illustrative purposes only. It is shown only to illustrate the correlation between the current investment strategy vs prior version, and does not indicate past or future performance. The correlation analysis is based on back-tested performance, not actual performance, because it is achieved through the retroactive application of a model portfolio designed with the benefit of hindsight. These simulated returns account for estimated transaction costs. In reality, costs (such as management fees and other costs) are also charged. These have a negative effect on the returns shown.

The chart illustrates how the current model differs from earlier iterations. It’s important to note that change is not made for its own sake but rather that a quantitative process needs to evolve as markets evolve. For investors, this matters because the strategy is not simply applying a fixed set of rules developed years ago. It is backed by an ongoing research process designed to keep the model relevant.

What makes the approach 3D?

Traditional portfolio construction often focuses on two dimensions: expected return and risk. Robeco’s 3D approach adds a third dimension: sustainability. In the Robeco 3D Global Equity UCITS ETF, return potential, benchmark-relative risk and sustainability metrics4 are integrated directly into the portfolio construction process.

Why does this matter? Because the objectives can interact. A portfolio designed only to maximize expected return could take too much active risk. A portfolio designed only to improve sustainability could create unintended sector, country or style biases. A portfolio designed only to minimize benchmark deviation might not make enough active choices to add value. The 3D framework seeks to balance these trade-offs. The strategy aims to identify attractive stocks, manage active risk and systematically consider financially material ESG risks5 in portfolio construction alongside benchmark constraints.

Sustainability is therefore not treated as a separate overlay after the portfolio has been built, but instead considered alongside return and risk from the beginning. Companies’ exposure to sustainability risks and opportunities can matter for long-term performance, and a disciplined investment process should take those risks into account. The objective is to integrate that third dimension without compromising the role of the ETF as a broad, benchmark-aware global equity allocation.

Track record

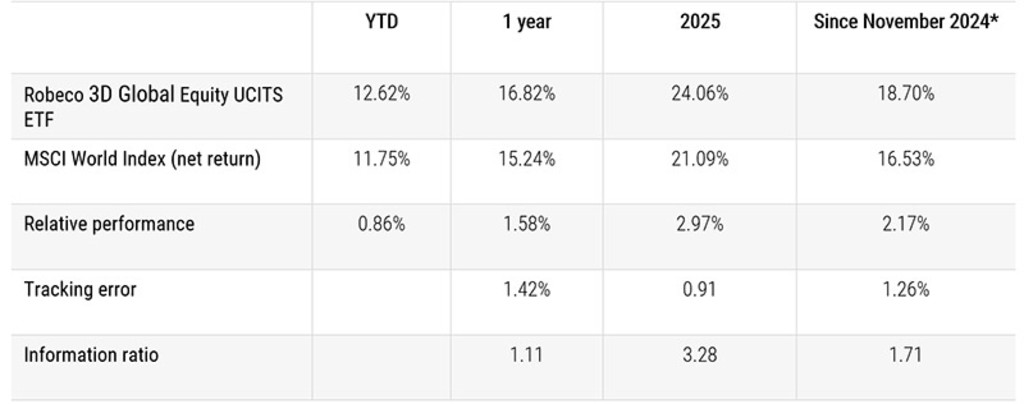
Although the ETF’s track record is still short, the strategy builds on Robeco’s broader enhanced-indexing capability, which has been developed over more than 20 years. The early performance record shows how the approach has so far translated into positive gross excess returns versus the benchmark, while remaining within a benchmark-aware framework.

Figure 4 | Track record

*Annualized.

Past performance is no guarantee of future results. The value of your investments may fluctuate.

Source: Robeco, MSCI. Portfolio: Robeco 3D Global Equity UCITS ETF USD Acc share class. The ETF is listed and traded on regulated markets including London Stock Exchange, Borsa Italiana, SIX Swiss Exchange AG and Deutsche Börse Xetra. Other share classes are available for this fund; performance information on other share classes is available upon request. Inception date: 9 October 2024. Index: MSCI World Index (net return). All figures in USD. Data end of September 2026. If the currency in which the past performance is displayed differs from the currency of the country in which you reside, then you should be aware that due to exchange rate fluctuations the performance shown may increase or decrease if converted into your local currency. Performance since inception is as of the first full month. Periods shorter than one year are not annualized. Returns gross of fees, based on gross asset value. Values and returns indicated here are before cost; the performance data does not take account of the commissions and costs incurred on the issue and redemption of units. These have a negative effect on the returns shown. Indices are unmanaged, and one cannot invest directly in an index. They do not reflect any fees, expenses or sales charges.

How the investor benefits

  1. Core global equity exposure, actively enhanced
    The ETF gives investors broad developed-market global equity exposure in a transparent and flexible active ETF wrapper, but with more than simple market-cap-weighted access.

  2. Proprietary stock selection
    Stock selection is based on long-term research, continuous testing and multiple proprietary signals, including value, quality, momentum, analyst revisions and short-term signals.

  3. Optimized 3D portfolio construction
    The strategy targets excess return while managing risk and integrating sustainability in a disciplined, pragmatic way.

Key risks to consider: Capital loss risk: The value of investments and the income from them may fluctuate and investors may not get back the amount originally invested. Equity & market risk: The strategy is subject to general equity market fluctuations and volatility in global developed markets. Model & factor risk: The strategy relies on proprietary quantitative models and factor definitions. If factor premia do not materialize as anticipated or market conditions change, the strategy may underperform its benchmark. Tracking error risk: While benchmark-aware, active stock selection means returns will deviate from the benchmark index. For a full overview of all applicable risks, please consult the Fund Prospectus and Key Information Document (KID/PRIIP).

For investors seeking developed-market global equity exposure, the Robeco 3D Global Equity UCITS ETF offers a systematic, research-driven alternative to passive investing: broad enough for the core, but selective enough to look beyond the index.

Explore the Robeco 3D Global Equity UCITS ETF

Our core strengths

Footnotes

1The Robeco 3D Global Equity UCITS ETF’s units / shares purchased on the secondary market cannot usually be sold directly back to Robeco 3D Global Equity UCITS ETF. Investors must buy and sell units / shares on a secondary market with the assistance of an intermediary (e.g. a stockbroker) and may incur fees for doing so. In addition, investors may pay more than the current net asset value when buying units / shares and may receive less than the current net asset value when selling them.
2 Diversification does not protect against loss in declining markets. There is no guarantee strategies will be successful.
3 Alpha refers to the excess return of an investment relative to a benchmark index and is a measure of performance.
4 The fund applies Robeco's standard exclusion policy to screen out controversial activities prior to investment (for detailed exclusion criteria, see www.robeco.com/exclusions). Within the remaining investable universe, sustainability is integrated directly into portfolio construction by targeting a 20% lower carbon footprint and a higher aggregate ESG score relative to the MSCI World Index, while financially material ESG factors are systematically evaluated in stock selection. The materiality of the exclusion is limited. Information with regard to the impact of the exclusions on the fund’s universe can be found at https://www.robeco.com/docm/docu-exclusion-list.pdf.
5 ESG integration refers to the systematic and explicit inclusion of financially material environmental, social, and governance (ESG) factors into investment analysis and portfolio construction decisions. ESG integration leads to better informed investment decisions.

Warning – Fraudulent use of Robeco on websites and social media Read more