Global Head of Fundamental Equity


• Insight
Targeting alpha in a global trade revolution
The trade war started by the new US government has prompted a severe stock market sell-off as economic confidence recedes amid uncertainty over the re-organization of complex global supply chains. This paradigm shift in trading conditions requires a more balanced global equity allocation to both developed and emerging markets.
Authors

Top keywords
Summary
- US exceptionalism is in question, even if Trump’s trade war is contained
- Long-term alpha generation will demand a more global footprint
- Rebalancing away from US assets and USD weakness will bolster EM
‘Liberation day’ on 2 April has had two impacts which will be enduring. First, US exceptionalism took a serious blow, with the imposition of sweeping global tariffs certain to drive US inflation, weaken the US economy and make it more difficult for leading US multinationals to operate globally. Second, the impact on the global economy ex-US will be deflationary, with lower demand and overcapacity in some sectors likely to manifest itself rapidly, with negative short-to-medium-term macroeconomic aftershocks.
At the time of President Trump’s inauguration, US equity market dominance had reached its zenith with the US accounting for 64% of the MSCI All World Index while the country accounts for 15.5% of global GDP in 2024.1
Figure 1: MSCI World is dominated by US companies
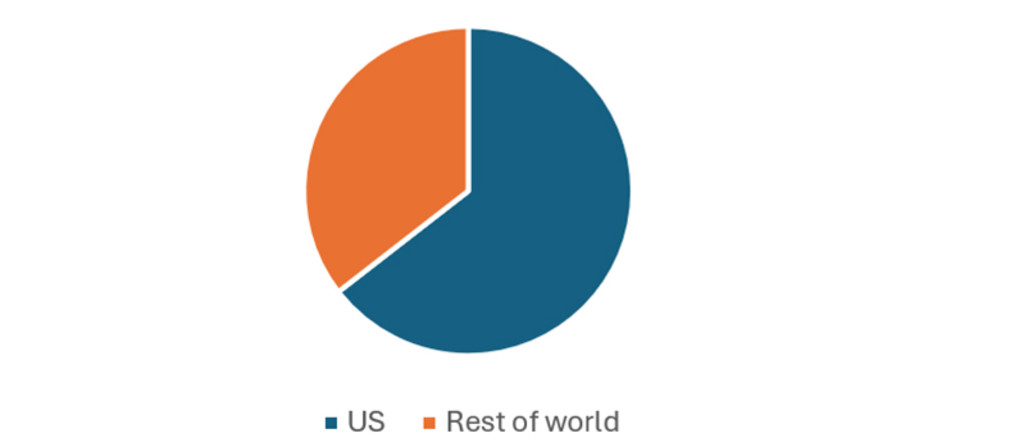
Source: MSCI. The MSCI ACWI captures large- and mid-cap representation across 23 developed markets (DM) and 24 emerging markets (EM) countries. With 2,558 constituents, the index covers approximately 85% of the global investable equity opportunity set.
Valuations also reflected this dominance, with the US CAPE ratio on 31 March 2025 at 32.8, compared to an average of 19 for developed markets (DM) and an average of 14 for emerging markets (EM).2 This US valuation premium seems certain to narrow as the US rewrites the rules of global competition.T
Read the complete insight and get our analysis of where to invest in this new global trading landscape.
Footnotes
1Source: Statista based on a Purchasing Power Parity measure of estimated 2024 GDP.
21Q25 Global Valuations – The Idea Farm - 8 April 2025. The CAPE ratio (cyclically adjusted price-to-earnings ratio), assesses whether the market is overvalued or undervalued by comparing current prices to average earnings over a 10-year period, adjusted for inflation.
Get the latest insights
Subscribe to our newsletter for investment updates and expert analysis.
Important information
THIS WEBSITE IS SOLELY INTENDED FOR PROFESSIONAL INVESTORS, WHICH HAS THE MEANING ASCRIBED TO IT IN THE SECURITIES AND FUTURES ORDINANCE (CAP. 571 OF THE LAWS OF HONG KONG) AND ITS SUBSIDIARY LEGISLATION. Investment involves risks. Past performance is not indicative of future performance. The information contained in this website is provided for reference only and does not constitute investment advice or an offer or solicitation to buy or sell in any securities or to adopt any investment strategy. Investors should not base their investment decisions solely on the information provided on this website and are advised to seek independent advice (including advice on tax implications) before making any investment decisions. Investors should ensure they fully understand the risks associated with the investment products and should also consider their own investment objectives and risk tolerance level. The investment decision is yours. You should not invest unless the intermediary who sells you the investment products has advised you that it is suitable for you and has explained how it is consistent with your investment objectives. Please refer to the relevant offering documents or other legal documents for further details including the risk factors. This website is published by Robeco Hong Kong Limited which is regulated by the Hong Kong Securities and Futures Commission (“SFC”) (CE No. APU851). This website has not been reviewed by the SFC. No assurance can be given that the investment objective of any investment products will be achieved. No representation or promise as to the performance of any investment products or the return on an investment is made. The value of investments may fluctuate. Past performance, projections, or forecasts included in this website should not be regarded as guarantees or indications of future performance, and no express or implied warranty is provided. The contents of this website are based on sources believed to be reliable, but due to the nature of information delivery technology and the necessity of using multiple data sources, including third party content, their accuracy is not guaranteed. The opinions expressed are as of the date shown above and may change as market conditions evolve, and are subject to change without notice. These opinions may differ from those of other Robeco investment professionals. Robeco accepts no liability for any direct, indirect, or consequential loss arising from the use of this material or any comments, opinions, or estimates contained herein. Robeco has no duty to update this website or any website content. Materials on this website may not be reproduced, distributed, or published without prior written permission from Robeco. Unless otherwise specified, Source: Robeco.