Strategist


• Monthly outlook
Finding diamonds in the rough
Marilyn Monroe once famously sang that “diamonds are a girl’s best friend” – but do they hold the same allure as a metaphor for stocks? Looking for hidden gems among small caps rather than fixating on the crown jewels in mega caps may well allow investors to beat the market next year, says strategist Peter van der Welle.
Authors



Top keywords
Summary
- Markets still follow the ‘soft landing’ narrative even though they’re usually wrong
- Small caps may have already discounted the mild recession we predict for 2024
- Looking for hidden gems likely to uncover more value than the ‘Magnificent Seven’
Stock markets are still expecting a soft landing for the global economy in 2024, but they have never been a good indicator for the likelihood of recessions. Still, equity investors can only invest in companies and not trend lines, whether their predictive power is good or not. Finding the stocks that can outperform the others during rough times remains the art of active management.
But it may well be time to reconsider the Magnificent Seven of mega-cap tech stocks that have dominated returns in the S&P 500 for several years, and look instead for the diamonds that lay somewhere in the smaller-cap Russell 2000, says Van der Welle, strategist with Robeco Sustainable Multi-Asset Solutions.
“The imperfect predictive powers of the stock market with regard to economic downturns tend to generate more false positives than false negatives,” he says. “Nobel laureate Paul Samuelson quipped in 1966 that ‘Wall Street indices predicted nine out of the last five recessions’. Risk aversion still rules the cycle.”
“Yet, could the market this time err on the side of negligence? While soft landings for the global economy are the exception rather than the rule, the latest Bank of America Merril Lynch survey shows 75% of asset managers expects a soft landing to materialize in 2024.”
“Stock markets have embraced this soft landing narrative, and all the more so in November after the October (core) US inflation numbers seemingly confirmed the Fed is on the path to achieve its 2% inflation target without tanking the economy.”
This optimism has been reflected by a stock market rally in 2023, though much has been led by the bullish sentiment embodied by the large-cap tech stocks, rather than the smaller-cap companies that may be giving a better reading of the underlying economy.
“The S&P 500 index is up 21% for the year, and short-term momentum is exceptionally strong,” Van der Welle says. “The typical equity market sell-off in the three to six months prior to the onset of a recession is nowhere to be seen.”
“Still, while the broad equity indices are all trending up in the year to date, the relative performance of small versus large caps reveals significant bearish undertones. This suggests that parts of the equity market may have already been anticipating an economic downturn after all.”
“In contrast to large caps, we think that small caps – more specifically the Russell 2000 – have by and large already discounted the mild recession that we in the multi-asset team do anticipate in 2024.”
“Sure, not all of its constituents are exactly diamonds, since around 40% of Russell 2000 companies are loss-making. Investors willing to weed through the rough could pick up some gems nonetheless.”
Peak-to-trough performances
The technicals in the stock market bear this out. The historical relative performance of the Russell 2000 currently almost matches the average peak-to-trough relative performance of the S&P 500 prior to the onset of a recession as defined by the National Bureau of Economic Research (NBER).
The Russell 2000 has lagged the S&P 500 by 29% since its cyclical peak in March 2021, when the typical recessionary peak-to-trough lag is 31%. This implies that the Russell 2000 has discounted 93% of the recession risk.
“Of course, history may not rhyme, as index ratios are not a stationary time series, since fundamental shifts in the economic structure may have caused structural breaks,” Van der Welle says. “For instance, small caps could face additional downside relative to large caps in a persistent above-target central bank inflation regime, where large-cap firms with the highest pricing power continue to take it all.”
A major inflection point
Another observation is that the Russell 2000 tends to outperform the S&P 500 after the trough of an NBER recession. “If our mild recession call in 2024 proves to be correct, next year could see a major inflection point, as the Russell 2000 has seen an average outperformance of 10% in the 200 trading days following a US recession trough,” Van der Welle says.
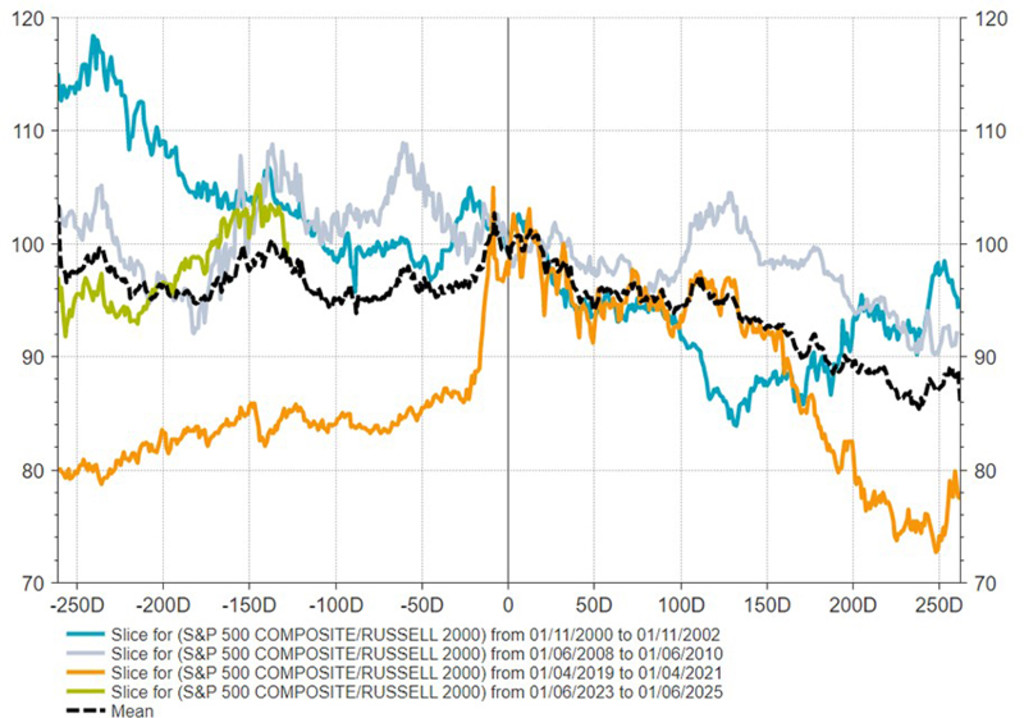
The S&P500 versus Russell 2000 performance around NBER recession troughs. Source: LSEG Datastream, Robeco
“This is corroborated by looking at data from the four phases of the business cycle: recovery, expansion, slowdown and recession. Data since 1988 confirms that during the recession and recovery signals, the S&P 500 typically lost ground to the Russell 2000.”
“The S&P 500 lost on average 0.2% on a monthly basis against the Russell 2000 when our business cycle monitor signaled recession. Applying the same analysis to the MSCI small caps 1750 index versus the MSCI large cap 300 index yields similar results.”
Get the latest insights
Subscribe to our newsletter for investment updates and expert analysis.
Not so Magnificent Seven?
So, should investors stick with the ’Magnificent Seven’ – Alphabet (Google), Amazon, Apple, Meta Platforms (Facebook), Microsoft, Nvidia and Tesla – for another year? Or look for opportunities in more unloved territory?
“We believe that small caps are well into the apathy phase of the investment sentiment cycle in the US and elsewhere,” Van der Welle says.
“Investors have flocked to the Magnificent Seven, though investors that have fundamental and active strategies will uncover some gems in small caps. While there could be additional relative downside for the Russell 2000 in the near term, we believe a mild US recession in 2024 could deliver an inflection point.”
Important information
THIS WEBSITE IS SOLELY INTENDED FOR PROFESSIONAL INVESTORS, WHICH HAS THE MEANING ASCRIBED TO IT IN THE SECURITIES AND FUTURES ORDINANCE (CAP. 571 OF THE LAWS OF HONG KONG) AND ITS SUBSIDIARY LEGISLATION. Investment involves risks. Past performance is not indicative of future performance. The information contained in this website is provided for reference only and does not constitute investment advice or an offer or solicitation to buy or sell in any securities or to adopt any investment strategy. Investors should not base their investment decisions solely on the information provided on this website and are advised to seek independent advice (including advice on tax implications) before making any investment decisions. Investors should ensure they fully understand the risks associated with the investment products and should also consider their own investment objectives and risk tolerance level. The investment decision is yours. You should not invest unless the intermediary who sells you the investment products has advised you that it is suitable for you and has explained how it is consistent with your investment objectives. Please refer to the relevant offering documents or other legal documents for further details including the risk factors. This website is published by Robeco Hong Kong Limited which is regulated by the Hong Kong Securities and Futures Commission (“SFC”) (CE No. APU851). This website has not been reviewed by the SFC. No assurance can be given that the investment objective of any investment products will be achieved. No representation or promise as to the performance of any investment products or the return on an investment is made. The value of investments may fluctuate. Past performance, projections, or forecasts included in this website should not be regarded as guarantees or indications of future performance, and no express or implied warranty is provided. The contents of this website are based on sources believed to be reliable, but due to the nature of information delivery technology and the necessity of using multiple data sources, including third party content, their accuracy is not guaranteed. The opinions expressed are as of the date shown above and may change as market conditions evolve, and are subject to change without notice. These opinions may differ from those of other Robeco investment professionals. Robeco accepts no liability for any direct, indirect, or consequential loss arising from the use of this material or any comments, opinions, or estimates contained herein. Robeco has no duty to update this website or any website content. Materials on this website may not be reproduced, distributed, or published without prior written permission from Robeco. Unless otherwise specified, Source: Robeco.